𝐏𝐫𝐨𝐣𝐞𝐜𝐭𝐢𝐧𝐠 𝐍𝐁𝐀 𝐓𝐞𝐚𝐦'𝐬 𝐓𝐨𝐭𝐚𝐥 𝐖𝐢𝐧𝐬
- stookyabhay
- Jan 28
- 3 min read

Abhay Pancharathi
Synopsis
How many games will each NBA team win? It's a complex, multifaceted question. In any given game, a team can outshoot another team but lose due to turnovers. Conversely, a team can be horrible for 44 minutes, and go on a run in the last 4 minutes. Hundreds of different variables and thousands of independent instances will end up having a huge impact on a game. It is almost impossible to predict who will win purely based on stats, but that is what I will attempt to do. Remember that it would be impossible to predict external factors such as injuries, coaches being fired, or off-the-court drama. For my process, I decided that first I would identify the factors that have a significant relationship with winning. To do this I decided to find the correlation between every possible variable and WIN%. After that, I would separate the variables that are deemed to be helpful and run a multiple regression analysis with these variables and the variable of WIN%. This would give me an equation that I can use to predict this year's teams. Finally, to check the accuracy of the equation, I will compare it with last year's results from the model, and the actual results.
Collecting Data and Separation of Variables
To find the data that I would use for this experiment, I went to the stats page on NBA.com and imported every team statistic that they had. Then, I ran a correlation test between every variable and the win% of each team to see what stats relate to winning. Using this, I identified the following variables as highly correlated (a Pearson correlation coefficient of above 0.75 or below -0.75): Plus/Minus, Net Rating, PIE(Player Impact Estimate), Offensive Rating, Defensive Rating, and Opponent's Plus/Minus. None of these were a real surprise, as they are mostly direct reflections of how good the offense and defense of a team are.

Multiple Regression Analysis
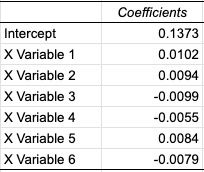
After isolating the variables, I ran a Multiple Regression Analysis between them and Win%. In doing this, I got a coefficient for each variable and used it to make an equation.

After cleaning this up a little, the equation we get is: Win% = 0.0102(Plus/Minus) + 0.0094(OffRtg) - 0.0099(DefRtg) - 0.0055(NetRtg) + 0.0084(PIE) - 0.0079(Opponent Plus/Minus) + 0.1373.
Interpreting Results
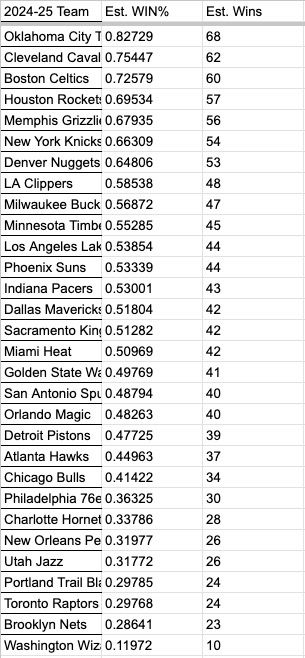
Multiplying the win% of each team by 82 allowed me to estimate the number of wins for each team. There were some minor changes to the current standings; although the Cleveland Cavaliers have the highest Win% in the league right now, the model suggests that they are overachieving and projects them to come down from 0.82 to 0.75. Conversely, the Boston Celtics are underperforming slightly, with a 0.69 win% now but an estimated 0.73 win%. The full results are here:

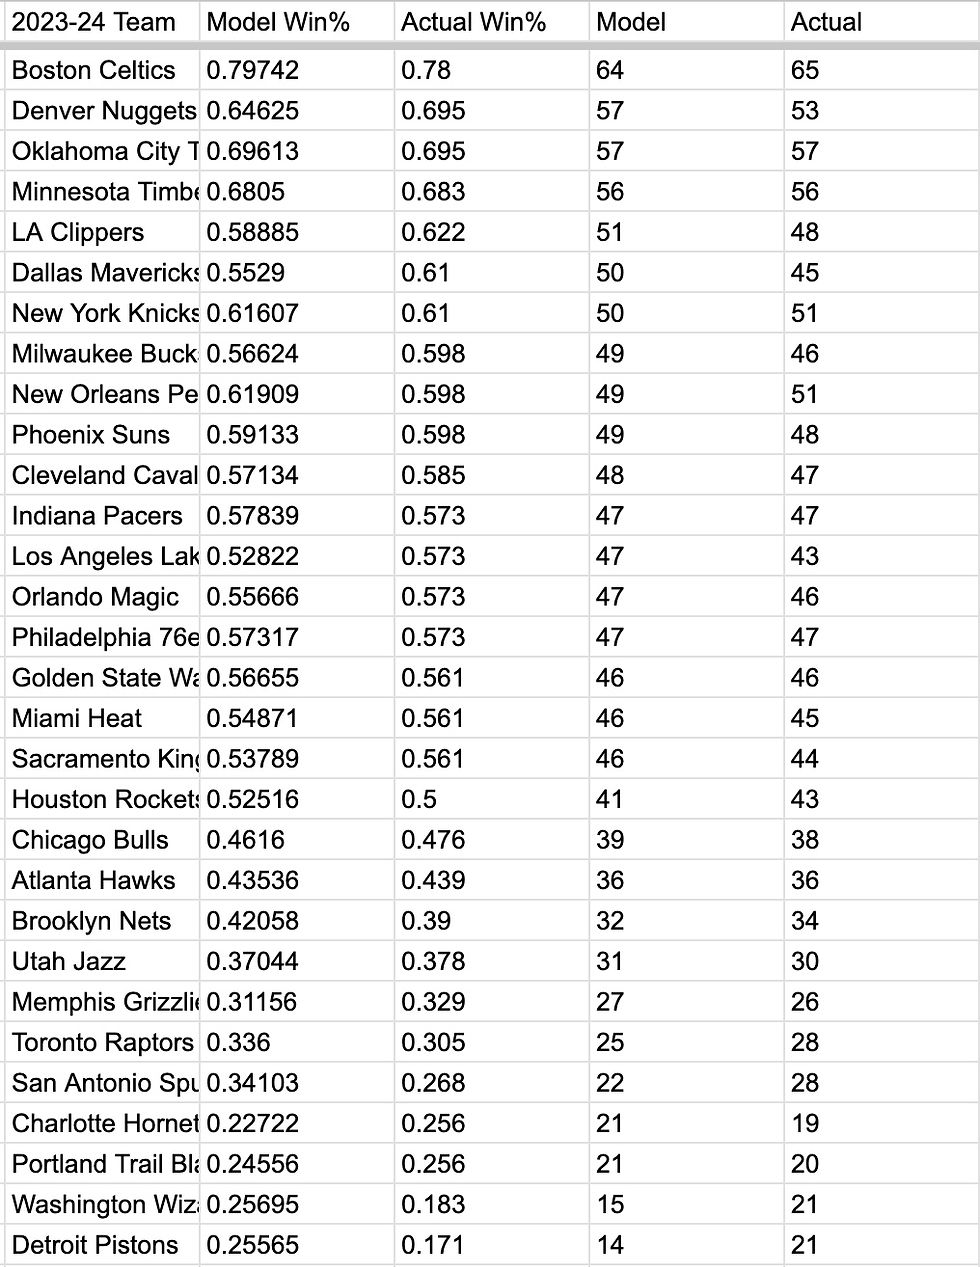
Although I look forward to checking back on this in a couple of months, I decided to see how accurate this formula was for last year. The NBA does not change drastically from year to year, so the accuracy of this formula on last year's team would be a good indicator of how accurate it is overall. The wins match up pretty well, although the model seems to struggle with the bottom of the standings teams.

Conclusion
Using a little bit of statistics and some context, we were able to predict the win totals for teams for this NBA season. Although it remains to be seen how accurate it is, the model highlights what is crucial to winning NBA games - mainly that it does not matter where the offense comes from (as highlighted when none of the shot location stats have a high correlation) but that a team does score. Also, it does not matter how many raw points they score, but rather how many they score on a per-possession basis. If a team gets 100 chances to score and scores 50 times, it is worse than a team having 70 chances to score and scoring 40 times, since most likely that means that their slow pace prevented the other team from having a lot of shooting opportunities.
Either way, I am excited to revisit these predictions at the end of the year and see what it was able to get right or wrong. An interesting follow-up would be to see how the regular season statistics have correlations to the playoffs since it is known that playoff basketball is a different beast. Many teams have been regular season merchants who have disappeared in the post-season (those Jazz teams with Donovan Mitchell and Rudy Gobert and the Rockets in the 2000s with Tracy McGrady come to mind). Of course, since this experiment was done before the trade deadline, trades and injuries can drastically alter these outcomes.
Comments